The fruitfulness of Riot API - Part 2
In Part 1, we revealed the advanced statistics we can obtain through Riot VALORANT API in the Match Page, including HS%, Clutches, Multikills, First Deaths and more.
With today's update, we're taking these statistics to a broader way, reflecting these stats for an Event. We're happy to announce the revamp of our stats page from just a limited Players comparison to give you Agents, Maps, Teams and Players statistics. All these statistics are updated in real time after a match is finished. You can have a look at past events like the FaZe Clan Invitational or even ongoing events like the LVL VALORANT Clash 2 Ignition Series, Mildom Masters or Popflash VALORANT Invitational.
OVERVIEW
When clicking the Stats link under the Event sub menu, the first page you will see will be an overview of the best Players and Teams based on ACS, amount of picks per agent and how much each map has been played.

TEAMS
The Teams page is one of the biggest updates we got for you today. The default view for the Teams page will be all matches for the Event you’re looking at. By selecting a team from the left hand side dropdown, you will be able to see the following statistics:
- Matches Win Rate
- Average Rounds Won in Losses
- Average Rounds Lost in Wins
- Per Map
- Win Rate
- Wins & Losses
- Attacking Win Rate
- Defending Win Rate
- Pistol Win Rate
- Top 3 Agent compositions for that team per map. Each composition include:
- Win Rate
- Attacking Win Rate
- Defending Win Rate
- Wins/Losses breakdown - This includes all the breakdown of the different combinations of wins and losses each team can have.
You can change the This Event filter and look back at the team history as well by the past 3 months, 6 months or 1 year. Of course, data between 6 months and 1 year will be the same for now.
Yes, there’s more. On top of all this, you can compare each team from the current Event and compare their statistics together. You can compare which agent composition each team picks most for each map, how they perform with that composition, their attacking and defending performances in each map and more!

PLAYERS
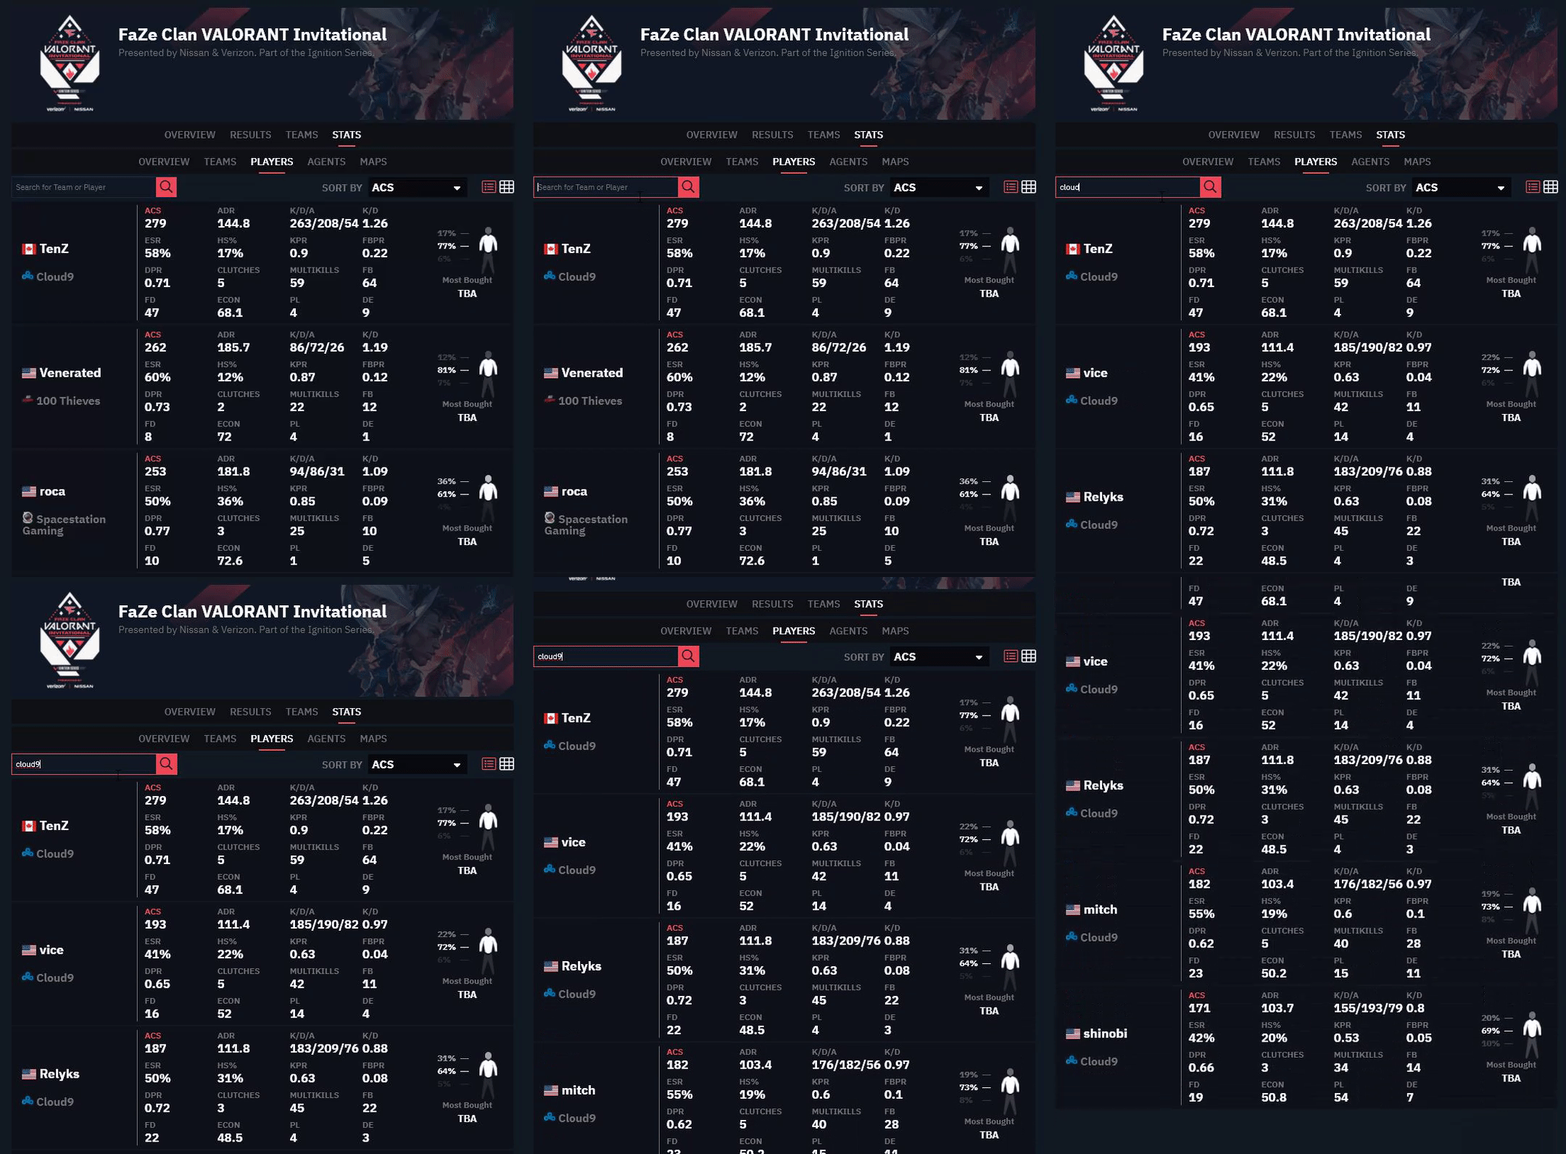
As you all know, the previous “Stats” tab had only players statistics with a limited amount of statistics available. We took this page functionality further and we are now providing two different views for the list of players; the list view (which is the default view) and the table view.
The list view gives you all the data of all the players immediately for the current Event we’re on, which also includes the newest statistics we made available in Part 1. Furthermore we added a dummy to show you also the amount of body shots and leg shots each player gets. The list view can be sorted accordingly using the Sort By dropdown.

The table view is the same table view we had before but you are now able to add/remove columns that you wish to see as you can see below. Each column can be sorted by clicking the title such as “ADR” to sort by average damage per round or “K” to sort by kills.

Both the table view and list view have a search function in case you want to search for a specific player or the whole team.

AGENTS
The agents statistics page also includes two views. The default view is the list view again similar to the Players view with a bit more data. For each agent you can expand more statistics per map. All this data is always related to the current Event we’re on.

The table view for Agents has the Overview table and the Performance Table. The overview table includes the following data per map:
- Pick Rate
- Win Rate
- Attacking Win Rate
- Defending Win Rate

The Performance table includes statistics related to kills, ACS, KDR and more for each map.

MAPS
The last page available for statistics of an Event is related to Maps. The All Maps section will show you how much each map has been played and how each side is performing on each Map.

Going into each map, you can see the most picked agents and also the most combined agent compositions. For both the Attacking and Defending sides we also have the Pistol Win Rate and Round 2 Conversion after winning the pistol round.

We hope you enjoyed this update as much as you did in Part 1 but most of all that these statistics are beneficial to the community, casters, team managers, coaches and the players themselves. We hope to see you around for Part 3 with another update to the Match page coming right up next week.
Latest News
Comments
vct 2023
For all information about the VCT 2023, check out our VCT Hub. There you will find our FAQ to answer all of your questions and details about the teams, different Leagues, and more.


